
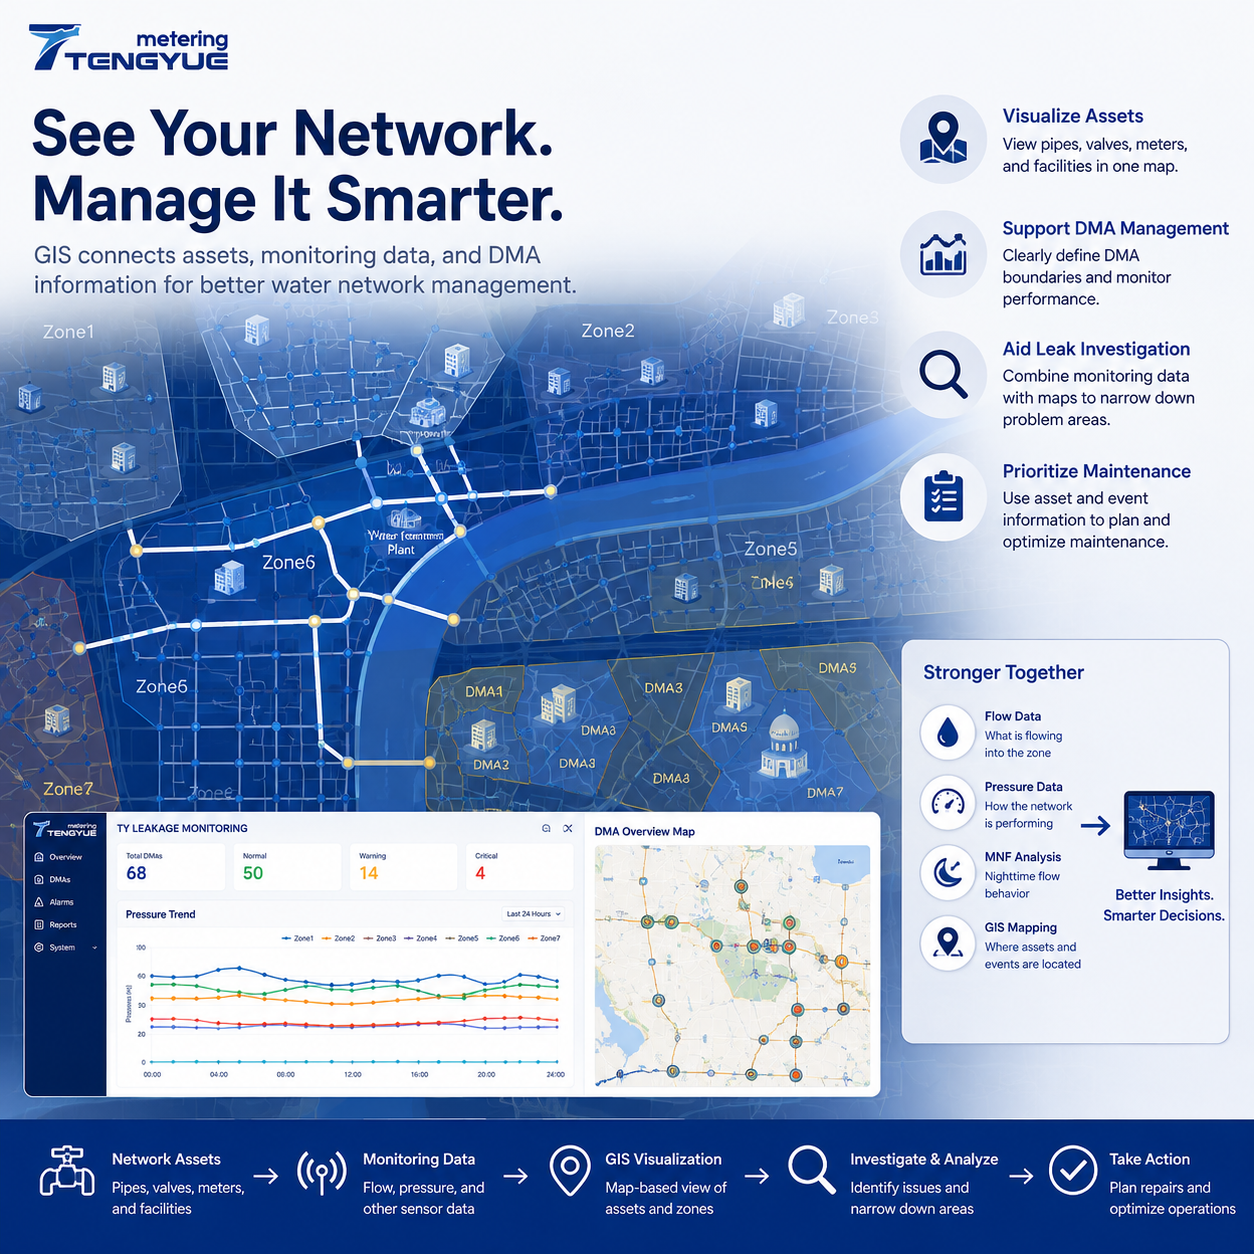
GIS water network management connects asset information with geographic locations, helping utilities see where pipes, valves, meters, DMA boundaries, and monitoring points are—and how they relate to operational data. Water distribution networks contain thousands of interconnected assets, including pipelines, valves, meters, pumps, and monitoring devices. For water utilities, understanding where these assets are located and how they relate to one another is essential for daily operation and long-term planning.
Geographic Information Systems (GIS) help utilities organize this information in a geographic context. When connected with monitoring data, GIS can become an important tool for water network management. It does not confirm a leak by itself, but it helps teams ask better questions, narrow field investigations, and prioritize maintenance.
Why GIS Water Network Management Matters
A water utility’s GIS is more than a map. It is a structured record of where assets are, how they connect, and which monitoring points serve which areas. ISO 19115 provides a widely used framework for describing geospatial metadata, which helps teams document source, accuracy, and update status. ISO 55000 asset management principles support aligning asset information with risk-based decisions.
For water network asset management, GIS helps answer questions such as: Which valves isolate this DMA? Which pipes serve this commercial area? Where is the nearest pressure logger? Which assets have a history of repeated repairs? These questions matter for both routine operations and emergency response.
For leak localization, GIS provides the spatial frame for interpreting flow and pressure anomalies. A flow increase in a DMA is more useful when the utility can see the nearby valves, branches, and monitoring points. GIS does not replace field verification, but it helps decide where field work should start.
What Does GIS Water Network Management Include?
In a water utility environment, GIS can be used to visualize water distribution pipelines, valves and other network assets, meter and sensor locations, DMA boundaries, maintenance and inspection records, and areas associated with operational events. Instead of reviewing asset information in disconnected records, teams can view relevant information on a map.
A useful GIS should link asset records to coordinates, DMA boundaries, and operational data. Data quality matters: asset coordinates in urban records are often expected to be accurate to within a few meters—commonly around 1–5 m—but actual accuracy depends on survey method, record age, and update process. OGC geospatial standards support interoperability between GIS and other utility systems, which is important when meter data, billing records, and asset registers must be viewed together.
| GIS data layer | Role in asset management | Role in leak localization |
|---|---|---|
| Pipe routes and topology | Shows connectivity and service areas | Narrows possible flow paths |
| Valve locations | Supports isolation planning | Guides step testing and field checks |
| DMA boundaries | Defines monitoring zones | Links flow anomalies to areas |
| Meter and sensor points | Shows monitoring coverage | Connects readings to locations |
| Maintenance history | Supports risk-based prioritization | Highlights repeat-problem assets |
The table is a general guide. The value of each layer depends on completeness, accuracy, and update frequency.
How Does GIS Support Water Network Asset Management?
Accurate asset records help utilities understand the location and configuration of their infrastructure. GIS provides a visual reference for pipelines, valves, meters, and other equipment. This can support maintenance planning, asset inspection, and infrastructure management. The usefulness of GIS depends on the completeness and accuracy of the underlying asset data.
Utilities often need to manage large asset inventories with limited maintenance resources. GIS can help combine asset location with other available information, such as pipe age, maintenance history, and recorded operational issues. This provides a more structured basis for deciding which areas or assets should receive attention first.
A practical asset management workflow includes: review asset criticality; check condition and maintenance history; identify geographic clusters of risk; plan inspection or replacement; and update the GIS record after work. A GIS that is not updated after repairs quickly becomes unreliable.
How Does GIS Support DMA Management and Leak Localization?
DMA boundaries define the areas in which water inflow and consumption can be monitored and compared. GIS helps utilities visualize these boundaries and understand how different zones relate to the wider distribution network. When combined with inlet meter readings and other monitoring information, it provides a geographic view of DMA operations.
When a monitoring system identifies an unusual flow pattern or a potential problem in a DMA, GIS can help teams review the associated network area. By viewing pipelines, valves, monitoring points, and zone boundaries together, investigators can narrow down the locations that need further inspection. GIS does not independently confirm the exact physical location of every leak. Field investigation and reliable network records remain important.
A stronger workflow combines several evidence sources: flow monitoring to understand water entering a zone; DMA water balance to identify discrepancies; pressure monitoring to examine hydraulic changes; MNF analysis to investigate persistent nighttime flow; and GIS visualization to relate anomalies to the physical network. The quality of the result depends on the accuracy of the asset map, the reliability of measurements, and how well the systems are integrated.
Connecting GIS with Flow, Pressure, and Monitoring Data
GIS becomes more valuable when it is connected with operational data. Flow meters provide information about water entering monitored areas. Pressure sensors provide information about hydraulic conditions at selected locations. MNF analysis helps identify unusual nighttime flow patterns. GIS places these measurements within the geographic structure of the network.
Tengyue’s TY Leakage Monitoring solution integrates GIS asset visualization with DMA management, water balance analysis, MNF trend analytics, and pressure-leakage correlation. This approach helps utilities move from viewing isolated measurements to understanding how monitoring information relates to actual network areas. The exact functions depend on the selected configuration.
Illustrative Scenario: From DMA Anomaly to GIS-Guided Field Check
Consider a desensitized example. A DMA with about 1,600 connections has a 28-day nighttime baseline of 2.8 m³/h between 02:00 and 04:00. Over six consecutive nights, average flow rises to 4.1 m³/h—about a 46% increase—while pressure remains broadly stable. GIS shows the anomaly near a valve and a branch serving a small industrial area.
The utility checks authorized nighttime use, confirms the pattern is sustained, and uses valve and DMA information to narrow the search area. Field verification then determines whether the cause is leakage, a valve issue, or an unrecorded night user. This example is illustrative and should not be read as a universal threshold.
What Should Utilities Consider Before GIS Integration?
Before starting a GIS integration project, utilities should review:
Asset data quality: Are pipeline locations and asset records sufficiently complete?
Coordinate consistency: Do different systems use compatible geographic references?
DMA boundaries: Are monitoring zones clearly defined and maintained?
Data integration: Can meter and sensor information be associated with the correct network locations?
Operational workflow: Can field and control-room teams use the information in their daily work?
Update responsibility: Who updates the GIS after repairs, new installations, and valve changes?
GIS integration is not simply a software installation. It also requires reliable asset records, consistent data management, and clear responsibilities. A GIS that is accurate at go-live but not maintained will lose value quickly.
GIS gives water utilities a geographic view of their distribution networks. When combined with flow measurement, pressure monitoring, and DMA analysis, it can support better asset visibility, more targeted leakage investigations, and more informed maintenance planning.
Frequently Asked Questions About GIS Water Network Management
What is GIS water network management?
It is the use of geographic information systems to organize, visualize, and analyze water network assets and monitoring data by location. It supports asset management, DMA management, leak investigation, and maintenance planning.
How does GIS support water network asset management?
GIS links asset records to coordinates and network topology, helping utilities review pipe routes, valve locations, maintenance history, and risk clusters. Its value depends on data completeness and regular updates after field work.
Can GIS confirm the exact location of a leak?
No. GIS helps narrow the investigation area by showing nearby pipes, valves, DMA boundaries, and monitoring points. Field verification and additional measurements are still required to confirm the cause and location.
What data layers are essential for GIS leak localization?
Useful layers include pipe routes and topology, DMA boundaries, valve and meter locations, monitoring points, pressure data, and maintenance records. Coordinate accuracy and update date should be documented for each layer.
How often should GIS asset data be updated?
There is no universal interval. Utilities should update records after repairs, new installations, valve changes, and DMA boundary revisions. A risk-based review can help decide how often critical layers are checked.