
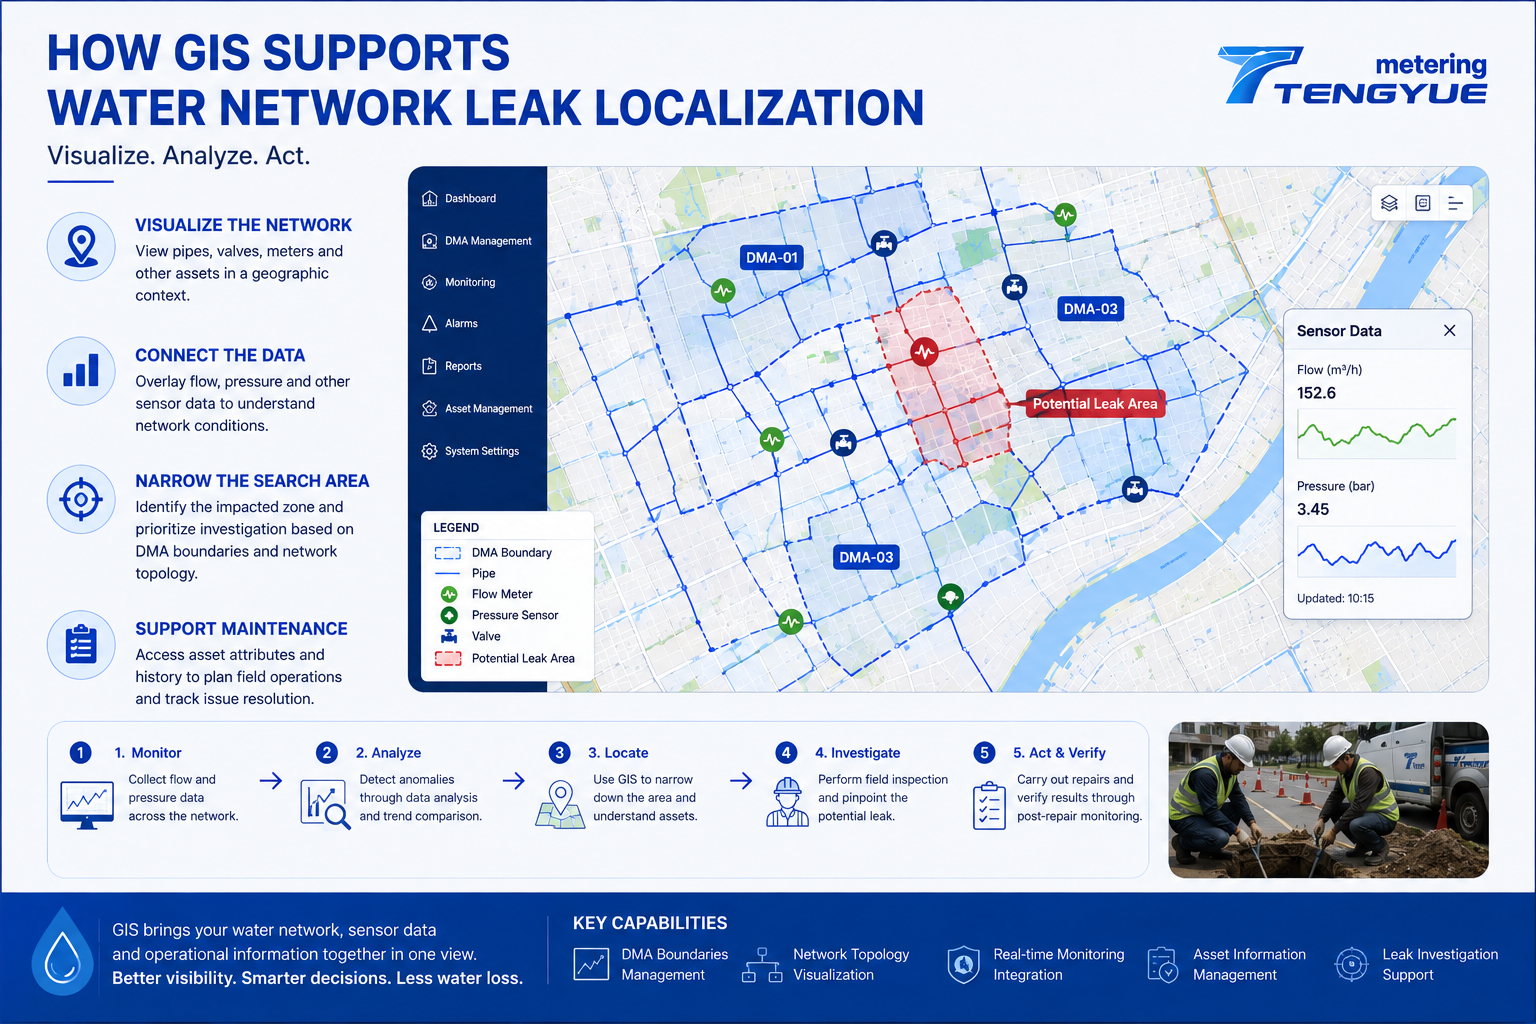
GIS for water network management connects asset information with geographic locations, helping utilities see where pipes, valves, meters, and DMA boundaries are—and how they relate to monitoring data. Water distribution networks can extend across large urban areas, with underground pipes, valves, meters, and other assets spread across complex systems. When abnormal flow or pressure patterns appear, utility teams need more than an alarm or a reading. They need to understand where the affected assets are located and how the network is connected. This is where Geographic Information Systems (GIS) can play an important role.
A GIS map does not confirm a leak by itself. Its value is to organize location, asset, and monitoring information so that investigators can form better questions, prioritize field checks, and coordinate repairs.
What Does GIS for Water Network Management Do?
GIS connects asset information with geographic locations. Depending on the available data and system configuration, a water utility’s GIS may include pipe routes and network connections, valve and meter locations, DMA boundaries and zone information, asset attributes and maintenance records, and monitoring points with related operational data.
This information gives teams a clearer view of the physical network and its management zones. It also supports water network asset management: teams can review where critical valves are located, which pipes serve a DMA, and which monitoring points are nearby. For leak localization, the map provides a spatial frame for interpreting flow and pressure anomalies.
A useful GIS is not only a drawing of pipes. It should link asset records to coordinates, DMA boundaries, and operational data. Data quality matters: asset coordinates in urban records are often expected to be accurate to within a few meters—commonly around 1–5 m—but actual accuracy depends on survey method, record age, and update process. ISO 19115 provides a widely used framework for describing geospatial metadata, which helps teams document source, accuracy, and update status.
How Can GIS Support Leak Investigations?
GIS supports leak investigations by turning monitoring results into location-aware information. The following four steps are a practical workflow.
1. Visualize the Network
A mapped network helps teams understand which pipes and assets are associated with an affected area. Pipe routes, valve locations, and DMA boundaries can be viewed together, so investigators can see whether an anomaly sits near a branch, a valve, or a zone boundary.
2. Connect Monitoring Data to Locations
When flow or pressure data indicates an anomaly, GIS can help display the relevant monitoring point, DMA boundary, and nearby network assets. Pressure loggers recording at 15-minute intervals, for example, can be plotted against flow readings to show whether a nighttime change coincided with a pressure change.
3. Narrow the Search Area
Combining monitoring results with network topology can help investigators prioritize a zone or group of assets rather than searching without a clear starting point. Nested DMAs, valve locations, and step-testing results can further narrow the area before field work begins.
4. Support Maintenance Decisions
When GIS is connected to asset and maintenance records, utilities can use location, asset condition, and previous incidents to help prioritize inspections and investment. ISO 55000 asset management principles emphasize aligned asset information and risk-based decisions; GIS can support that alignment by keeping location and condition data visible.
| GIS data layer | Role in leak localization | Quality check before use |
|---|---|---|
| Pipe routes and topology | Shows connectivity and possible flow paths | Confirm update date and geometry accuracy |
| DMA boundaries | Defines the monitored area and zone logic | Check boundary version and valve status |
| Valve and meter locations | Supports isolation planning and field checks | Verify coordinates and asset IDs |
| Monitoring points and pressure data | Links flow/pressure anomalies to locations | Check time synchronization and calibration |
What Data Does GIS Need for Reliable Leak Localization?
Reliable GIS leak localization depends on more than a base map. Useful inputs include DMA inflow data, DMA water balance, pressure monitoring, minimum night flow (MNF) analysis, asset attributes, maintenance history, and field verification records. IWA water loss methodology and AWWA M36 provide widely used frameworks for interpreting flow and pressure data in leakage management.
Data quality should be documented. A practical checklist includes coordinate accuracy, asset ID consistency, DMA boundary version, monitoring point location, sensor calibration, and time-stamp alignment. If a GIS layer is outdated, a flow anomaly may point to the wrong asset. If pressure and flow clocks are not aligned, a real relationship may be missed. Utilities should therefore record data source, update date, and confidence level for each layer.
Why GIS for Water Network Management Works Better with DMA and Monitoring Data
GIS is not a substitute for accurate measurements. A map alone cannot confirm that a leak exists. A stronger workflow combines several sources of evidence: flow monitoring to understand water entering a zone; DMA water balance to identify discrepancies between inflow and authorized consumption; pressure monitoring to examine hydraulic changes; MNF analysis to investigate persistent nighttime flow; and GIS visualization to relate anomalies to the physical network.
The quality of the result depends on the accuracy of the asset map, the reliability of measurements, and how well the systems are integrated. GIS for water network management is most useful when it is part of a repeatable process: detect an anomaly, check supporting data, narrow the area, verify in the field, and update the record.
Illustrative Scenario: From DMA Anomaly to Field Check
Consider a desensitized example. A DMA with about 1,600 connections has a 28-day nighttime baseline of 2.8 m³/h between 02:00 and 04:00. Over six consecutive nights, average flow rises to 4.1 m³/h—about a 46% increase—while pressure remains broadly stable. GIS shows the anomaly near a valve and a branch serving a small industrial area.
The utility checks authorized nighttime use, confirms the pattern is sustained, and uses valve and DMA information to narrow the search area. Field verification then determines whether the cause is leakage, a valve issue, or an unrecorded night user. This example is illustrative and should not be read as a universal threshold.
From Network Maps to Actionable Information
TY Leakage Monitoring integrates GIS asset visualization with DMA boundaries, network topology, and sensor data to support leak investigation and localization. Depending on configuration, teams can view monitoring points alongside network assets and use that context to plan field checks.
For water utilities, the goal is to make operational information easier to interpret and use. When monitoring data and network assets are viewed together, teams can better plan field checks, coordinate repairs, and improve the management of underground infrastructure. A useful water network map does more than show where pipes are. It helps connect what the utility measures with where the next action may be needed.
Frequently Asked Questions About GIS for Water Network Management
What is GIS for water network management?
GIS for water network management is a system that links asset records—pipes, valves, meters, DMA boundaries, and monitoring points—to geographic locations. It helps utilities visualize the network and relate operational data to specific areas.
How does GIS support leak localization?
GIS supports leak localization by showing where monitoring anomalies occur in relation to pipes, valves, DMA boundaries, and other assets. It helps teams narrow the search area, but field verification is still needed to confirm the cause.
What data layers are essential for GIS leak localization?
Useful layers include pipe routes and topology, DMA boundaries, valve and meter locations, monitoring points, pressure data, and maintenance records. Data accuracy, update date, and time synchronization should be documented.
Can GIS confirm a leak without field verification?
No. GIS is a spatial decision-support tool. It can help prioritize areas and assets, but it cannot confirm a leak without supporting measurements and field checks.
How often should GIS asset data be updated?
There is no universal interval. Utilities should update records after repairs, new installations, valve changes, and DMA boundary revisions. A risk-based review—consistent with ISO 55000 principles—can help decide how often critical layers are checked.
If you are connecting DMA monitoring data with network maps, contact our engineers to discuss a GIS-based leak investigation workflow for your utility.