
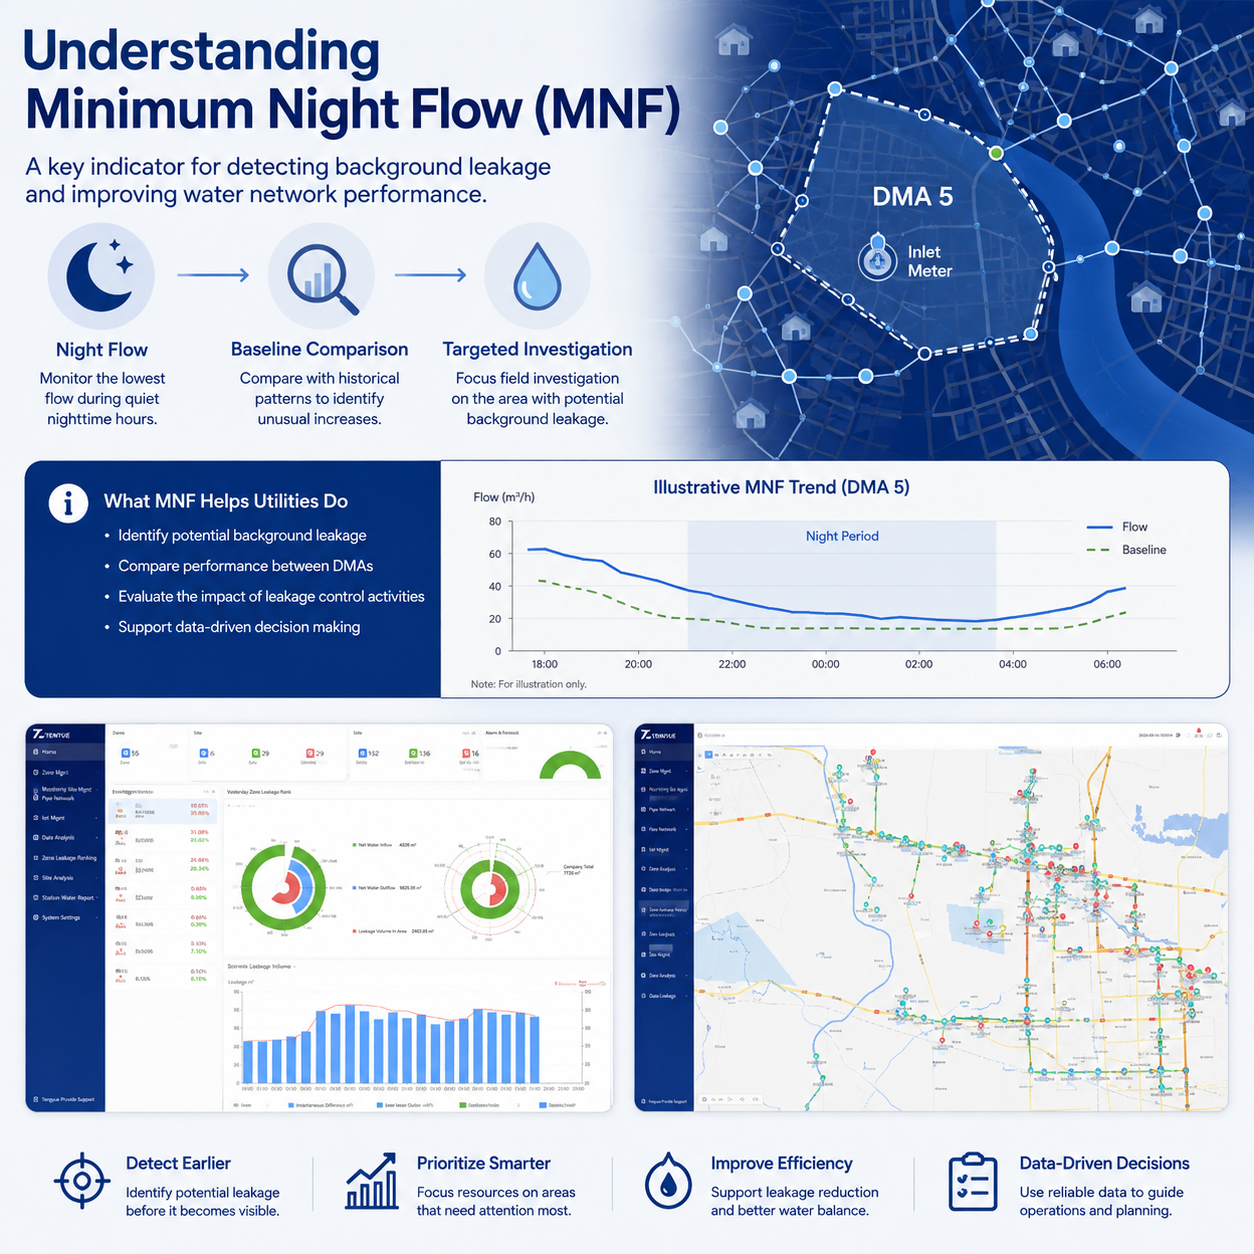
Minimum night flow (MNF) is the lowest recorded flow entering a defined water distribution area during a selected nighttime period. Water consumption changes throughout the day. In most distribution networks, demand decreases during late-night hours when fewer people and businesses are using water. For water utilities, this quieter period provides an important opportunity to investigate potential leakage.
MNF is one of the commonly used indicators in water loss management. When analyzed together with other operational information, it can help utilities identify areas that may require further investigation. It is not a direct measurement of leakage, and it should not be treated as a standalone leak detector. Its value comes from trend comparison, operational context, and a structured follow-up process.
What Does Minimum Night Flow Mean in a DMA?
In a District Metered Area (DMA), utilities monitor the flow entering the zone and analyze how it changes over time. During the night, legitimate consumption usually decreases. If the measured inflow remains unexpectedly high, background leakage may be one possible explanation.
However, MNF is not a direct measurement of leakage. Nighttime consumption, industrial activities, storage tanks, pressure conditions, and other operational factors must also be considered. IWA water loss methodology and AWWA M36 provide widely used frameworks for interpreting flow and leakage indicators; both emphasize that nighttime flow should be assessed with supporting data rather than in isolation.
A practical definition should specify the nighttime window, the averaging method, and the baseline period. For example, a utility might define MNF as the average flow between 02:00 and 04:00, compared with a 28-day rolling baseline. These are illustrative choices, not universal rules. Local demand patterns, network size, and data completeness should determine the final method.
Why Minimum Night Flow Matters for Water Utilities
Identifying potential background leakage. Small leaks may continue for long periods without producing visible signs on the surface. By comparing nighttime flow with historical patterns and expected legitimate consumption, utilities can identify zones that deserve closer attention.
Comparing performance between DMAs. A water network divided into DMAs can be monitored zone by zone. This allows utility teams to compare nighttime flow trends across different areas, identify unusual changes, and prioritize field investigations.
Evaluating the impact of repair work. MNF trends can also help utilities review whether a repair or leakage-control activity has changed the flow pattern. Comparisons should use consistent monitoring periods and account for changes in demand and operating conditions.
MNF is most useful when it supports prioritization, not when it is used to declare a leak. A sustained change in night flow tells a utility where to look next; it does not tell the utility exactly what is wrong.
How Does MNF Analysis Work?
A practical MNF investigation generally involves five steps.
Step 1: Define the DMA. Establish a clearly defined monitoring area with known inlet flow measurement points. Boundary valves should be documented and their status confirmed.
Step 2: Collect flow data. Record flow data at suitable intervals and maintain consistent monitoring conditions. For trend review, 15-minute interval data is often useful. Meter accuracy and low-flow resolution should be checked against the expected nighttime flow range.
Step 3: Identify the nighttime flow pattern. Review the flow curve to identify the minimum nighttime period and compare it with historical baselines. A single unusual night is rarely enough; a sustained pattern over several nights is more informative.
Step 4: Consider legitimate night consumption. Account for residential use, commercial operations, industrial demand, and other authorized consumption. Hospitals, night-shift businesses, and storage tank filling can all keep nighttime flow elevated.
Step 5: Investigate unusual results. If a zone shows an unexpected increase, use additional information such as pressure data, GIS network records, and field inspections to narrow down the possible source. MNF narrows the question; field verification answers it.
| Nighttime signal | Возможная интерпретация | Полезная следующая проверка |
|---|---|---|
| Single high reading | Temporary event, measurement issue, or short-term use | Repeat measurement and check alarms |
| Sustained rise over several nights | Changed nighttime use, pressure change, or background leakage | Review pressure, authorized use, and DMA inflow |
| Rise with stable pressure | Possible change in consumption or leakage | Check night users and field conditions |
| Rise with higher pressure | Pressure-driven flow increase possible | Review pressure management and baseline |
| Gradual seasonal drift | Demand or temperature effect possible | Compare with seasonal baseline |
The table is a general guide, not a diagnostic rule. Interpretation depends on the DMA’s specific operating context.
Why DMA Management and Pressure Data Matter
MNF analysis is more useful when the monitored area has clear boundaries and reliable inlet measurement. Without well-defined zones, it can be difficult to determine where water enters, where consumption occurs, and which area is responsible for an unusual flow pattern.
A DMA management system can combine inlet flow measurement, pressure monitoring at selected points, water balance analysis, nighttime flow trend analysis, and GIS visualization of network assets. Pressure data is particularly important because higher nighttime pressure can increase background leakage and change the MNF baseline. Flow and pressure should be reviewed together, not separately.
ISO 4064 is relevant to the accuracy of the inlet meter; a meter that cannot resolve low nighttime flow may distort MNF analysis. ISO 55000 asset management principles support risk-based decisions about which DMAs to investigate first and how to prioritize repairs.
Мониторинг утечек TY includes DMA management, water balance reconciliation, MNF trend analytics, GIS asset visualization, and pressure-leakage correlation to support structured leakage investigation. The exact functions depend on the selected configuration.
Can Minimum Night Flow Confirm a Leak?
A high MNF value does not automatically confirm a leak. It indicates that the area may need further analysis. Utilities should consider legitimate nighttime consumption, pressure conditions, meter performance, and operational changes before deciding where to send repair teams.
MNF helps identify a potential water-loss problem within a monitored area, but it does not automatically identify the exact pipe or leak point. More detailed localization may require pressure-flow correlation, nested DMA analysis, GIS network information, and field verification.
Illustrative Scenario: A Sustained Nighttime Flow Increase
Consider a desensitized example. A DMA with about 1,350 connections has a 28-day nighttime baseline of 3.4 m³/h between 02:00 and 04:00. Over six consecutive nights, average flow rises to 4.8 m³/h—about a 41% increase—while pressure remains broadly stable and known nighttime users report no change.
The utility reviews DMA inflow and pressure logs, confirms the pattern is sustained, and uses GIS asset information and step testing to narrow the investigation area. Field verification then determines whether the cause is leakage, a valve issue, or an unrecorded night user. This example is illustrative and should not be read as a universal threshold.
Frequently Asked Questions About Minimum Night Flow
What is minimum night flow (MNF)?
MNF is the lowest recorded flow entering a defined area, such as a DMA, during a selected nighttime period. It is used as an indicator for investigating potential background leakage when legitimate nighttime consumption is low.
Does a high minimum night flow always mean leakage?
No. Hospitals, industry, storage tanks, night-shift businesses, and other authorized uses can keep nighttime flow elevated. Pressure changes and metering issues can also affect readings. MNF should be interpreted with supporting operational data.
What is a good minimum night flow for a DMA?
There is no universal value. MNF depends on DMA size, customer mix, pressure, infrastructure condition, and legitimate nighttime use. Utilities should establish a local baseline and look for sustained deviations rather than compare raw values across different DMAs.
How long should MNF be monitored before drawing conclusions?
Many utilities review multiple nights and compare against a rolling baseline, such as 28 days, while also checking seasonal patterns. A single unusual night is rarely sufficient; a sustained pattern over several nights is more informative.
How does pressure affect minimum night flow?
Higher nighttime pressure can increase background leakage and some consumption. Pressure management can change the MNF baseline, so flow and pressure should be reviewed together rather than in isolation.