
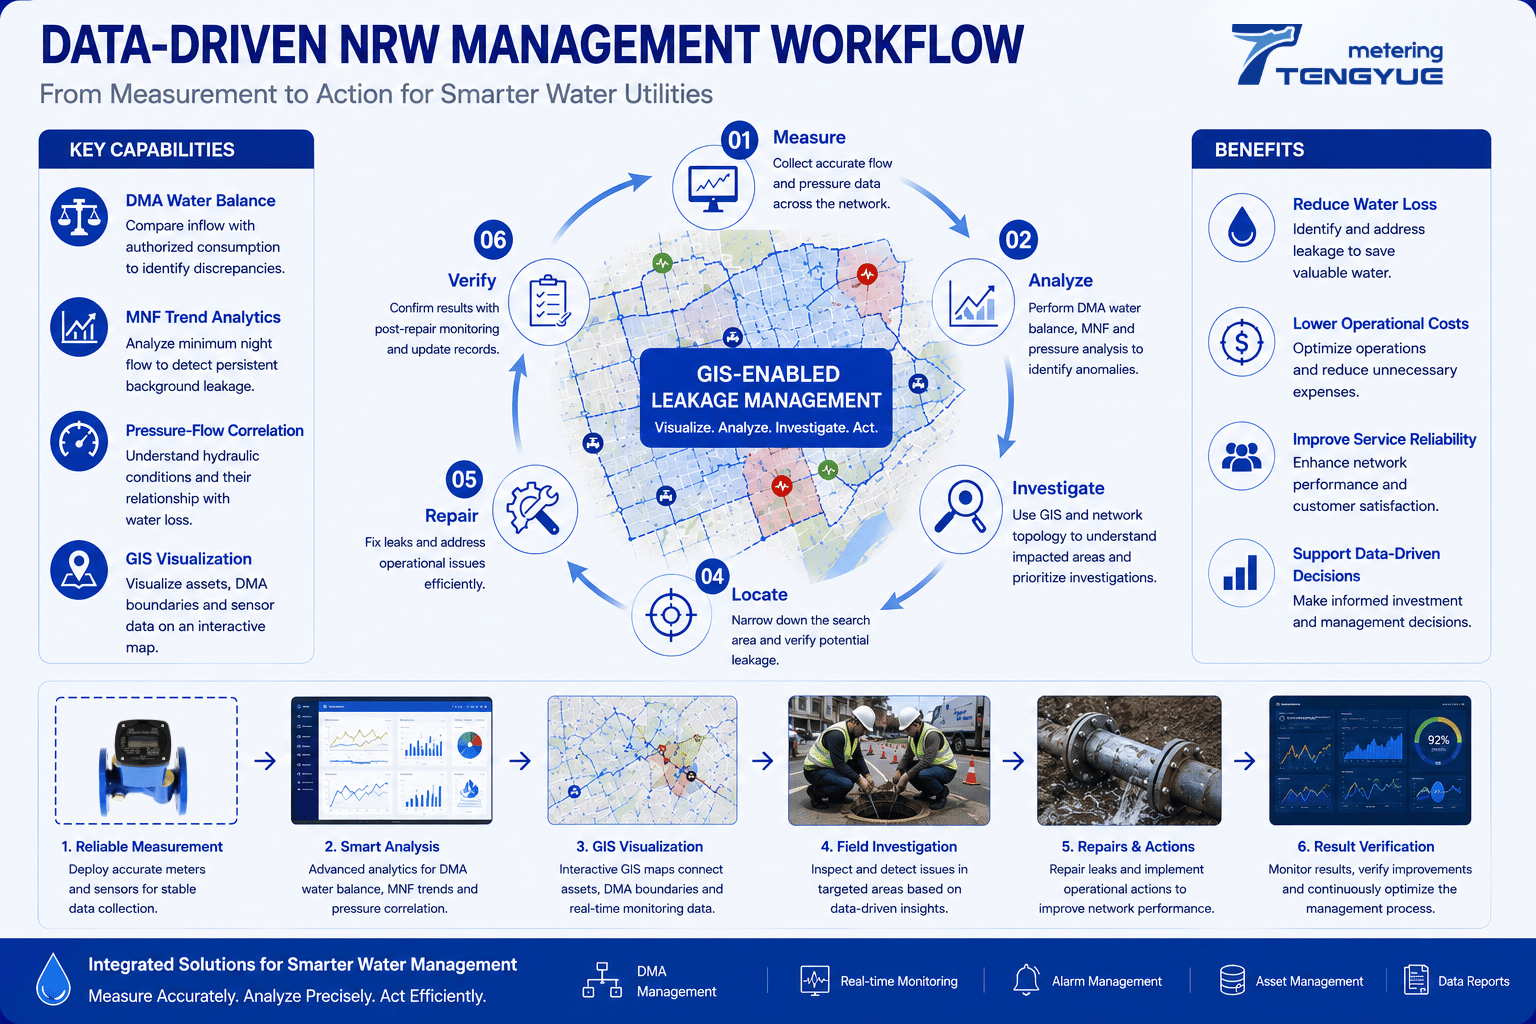
NRW management is the structured process of reducing non-revenue water by connecting measurement, analysis, investigation, and follow-up. Non-revenue water (NRW) is a complex challenge for water utilities. Water losses may be associated with physical leakage, inaccurate measurement, unauthorized consumption, or weaknesses in data and operational processes. Installing meters or collecting more readings is only one part of the solution. Utilities also need a practical way to interpret the information and turn it into action.
A data-driven NRW management workflow helps teams move from raw readings to prioritized field work. It does not assume that every unexplained cubic meter is leakage. Instead, it uses flow, pressure, DMA water balance, minimum night flow (MNF), GIS, and field verification to build evidence step by step.
What Is a Data-Driven NRW Management Workflow?
A data-driven NRW management workflow is a repeatable process for measuring network performance, identifying anomalies, investigating likely causes, taking action, and checking results. It combines several evidence sources: bulk and customer metering, DMA water balance, pressure monitoring, MNF analysis, GIS asset visualization, and field verification.
The workflow is not a one-time equipment installation. It is an operating cycle. IWA water loss methodology and AWWA M36 provide widely used frameworks for defining water balance components and interpreting leakage indicators. ISO 4064 is relevant to water meter accuracy, while ISO 55000 asset management principles support risk-based decisions about inspections and investment.
A useful workflow should answer four questions: What is happening? Where is it happening? What evidence supports the interpretation? Did the action improve performance?
How Do Utilities Calculate a DMA Water Balance?
A practical DMA water balance process can be organized into five steps.
Step 1: Measure DMA Inflow
Collect reliable readings at DMA boundaries. Boundary flow meters should have known accuracy, synchronized time stamps, and a clear data-completeness record. For trend review, 15-minute interval data is often useful, while billing data may be monthly.
Step 2: Collect Consumption Data
Compile authorized-use information for the same period. Separate billed authorized consumption from known authorized unbilled consumption where possible. Align billing and meter-reading periods with the flow period; otherwise the balance may show a false difference.
Step 3: Reconcile the Balance
Compare inflow with accounted consumption using the simplified formula, then document adjustments and measurement uncertainty. A formal water balance should show which components are included and which are estimated.
Step 4: Identify Unusual Patterns
Review persistent or significant discrepancies rather than a single day. A 28-day rolling comparison can help distinguish a sustained change from a temporary event or measurement issue.
Step 5: Investigate the Zone
Use pressure data, minimum night flow (MNF) trends, GIS information, and field checks to determine likely causes. The water balance narrows the question; it does not replace field verification.
Step 1: Improve Visibility with Reliable Measurement
Accurate and consistent flow data helps utilities understand how water moves through their distribution networks. Bulk metering at appropriate network boundaries can support DMA monitoring, while customer metering and consumption records provide information needed for water balance analysis.
The measurement approach should match the application, operating conditions, and required data quality. For trend analysis, 15-minute interval flow and pressure data is often useful, while billing data may be monthly. Utilities should document meter calibration, reading intervals, time synchronization, and data completeness. If the measurement layer is weak, every later analysis becomes less reliable.
Smart metering for water utilities can improve visibility, but more data is not automatically better data. The key is consistent measurement and a clear record of what each data point represents.
Step 2: Establish a DMA Water Balance
Dividing the network into manageable zones helps utilities compare inflow with authorized consumption. A simplified DMA water balance difference is:
DMA inflow − accounted authorized consumption = unaccounted difference
For example, a DMA with 1,000 m³/day inflow and 820 m³/day accounted authorized consumption shows a simplified difference of 180 m³/day, or about 18% of inflow. This is an investigation signal, not a final leakage figure. A formal IWA water balance separates authorized consumption, apparent losses, real losses, and measurement uncertainty.
A persistent discrepancy can indicate where further analysis is needed. Reviewing the balance by zone also helps teams prioritize investigations instead of treating the entire network as one undifferentiated system. Utilities should check meter accuracy, billing-period alignment, boundary valve status, and known authorized unbilled use before drawing conclusions.
Step 3–4: Use MNF, Pressure, and GIS to Guide Investigations
Minimum night flow analysis helps utilities investigate persistent nighttime flow that may indicate background leakage. Pressure monitoring adds information about network operating conditions. When pressure and flow patterns are assessed together, utilities can investigate abnormal conditions more systematically. Neither indicator should be used alone to declare a confirmed leak.
GIS can connect DMA boundaries, pipe routes, asset records, and monitoring locations. When a zone shows an unusual water balance or MNF trend, this spatial information helps teams understand the affected network and narrow the area for field inspection. Additional measurements and on-site verification may still be required to confirm the source.
| Data signal | Possible interpretation | Useful next check |
|---|---|---|
| Persistent DMA balance difference | Real losses, apparent losses, or data issue possible | Check meters, billing alignment, and boundary valves |
| Rising MNF with stable pressure | Changed nighttime use or background leakage possible | Review authorized night users and field conditions |
| Flow and pressure change together | Pressure-driven flow or measurement issue possible | Compare 15-minute logs and pressure management records |
| GIS shows anomaly near a valve or branch | Localized investigation area possible | Plan valve check, step testing, or field survey |
Illustrative Scenario: From Data Signal to Field Check
Consider a desensitized example. A DMA with about 1,200 connections has a 28-day nighttime baseline of 3.0 m³/h between 02:00 and 04:00. Over six consecutive nights, average flow rises to 4.2 m³/h—about a 40% increase—while pressure remains broadly stable. The DMA water balance also shows an unexplained difference of about 90 m³/day after known uses are reconciled.
The utility reviews MNF trends, pressure logs, and GIS asset information, then narrows the search area around a branch and valve. Field verification determines whether the cause is leakage, a valve issue, or an unrecorded night user. This example is illustrative and should not be read as a universal threshold.
Step 5: Repair, Verify, and Monitor Again
An investigation should lead to a clear operational response. After a suspected leak is repaired or a pressure-management action is implemented, utilities should review subsequent flow and pressure data to evaluate whether the expected improvement occurred. This feedback loop helps teams assess actions, identify recurring issues, and refine their priorities over time.
Verification should use the same measurement logic as the original investigation. If the DMA balance difference falls and MNF returns toward baseline, the action may have addressed the issue. If not, the team should review data quality, network configuration, and alternative causes. Consistent follow-up turns NRW management from a series of isolated repairs into a continuous improvement process.
TY Leakage Monitoring brings together capabilities relevant to this workflow, including DMA boundary metering and water balance reconciliation, MNF trend analytics, pressure-flow correlation analysis, GIS asset and network visualization, and data analysis to support leakage investigation and operational decisions. The value lies in connecting these functions rather than treating each measurement or tool as a separate activity. The exact workflow depends on the utility’s existing infrastructure, data availability, network configuration, and operational objectives.
Frequently Asked Questions About NRW Management
What is a data-driven NRW management workflow?
A data-driven NRW management workflow connects metering, DMA water balance, pressure monitoring, MNF analysis, GIS, field verification, and follow-up. It helps utilities prioritize investigations and verify results rather than relying on a single reading.
How does DMA water balance support NRW management?
DMA water balance compares zone inflow with accounted authorized consumption. A persistent unexplained difference can help utilities decide where to check meters, billing data, boundary valves, pressure, and field conditions.
How does minimum night flow analysis help reduce non-revenue water?
MNF analysis helps investigate persistent nighttime flow when legitimate consumption is usually low. It supports prioritization and follow-up, but it does not confirm leakage without supporting data and field verification.
What role does GIS play in NRW leak localization?
GIS links monitoring anomalies to pipes, valves, DMA boundaries, and asset records. It helps teams narrow the search area and plan field checks, but it does not replace measurements or on-site verification.
How often should utilities review NRW performance?
Frequency depends on meter-reading cycles, data availability, and operational objectives. Many utilities review monthly water balances, use rolling periods such as 28 days for trend comparison, and check critical DMA data more frequently.
If you are building a data-driven NRW management workflow, contact our engineers to discuss DMA monitoring, MNF analysis, pressure monitoring, and GIS-based investigation for your utility.